A message from EatThePlanet.org: "We are happy you found us! We strive to be informative and accurate. Enjoy what you find here! Take a look at our new downloadable pdf eBook A Complete Guide To Foraging. We put a lot of work into this eBook and are very excited to share it with you." - Joe Forager(Owner)
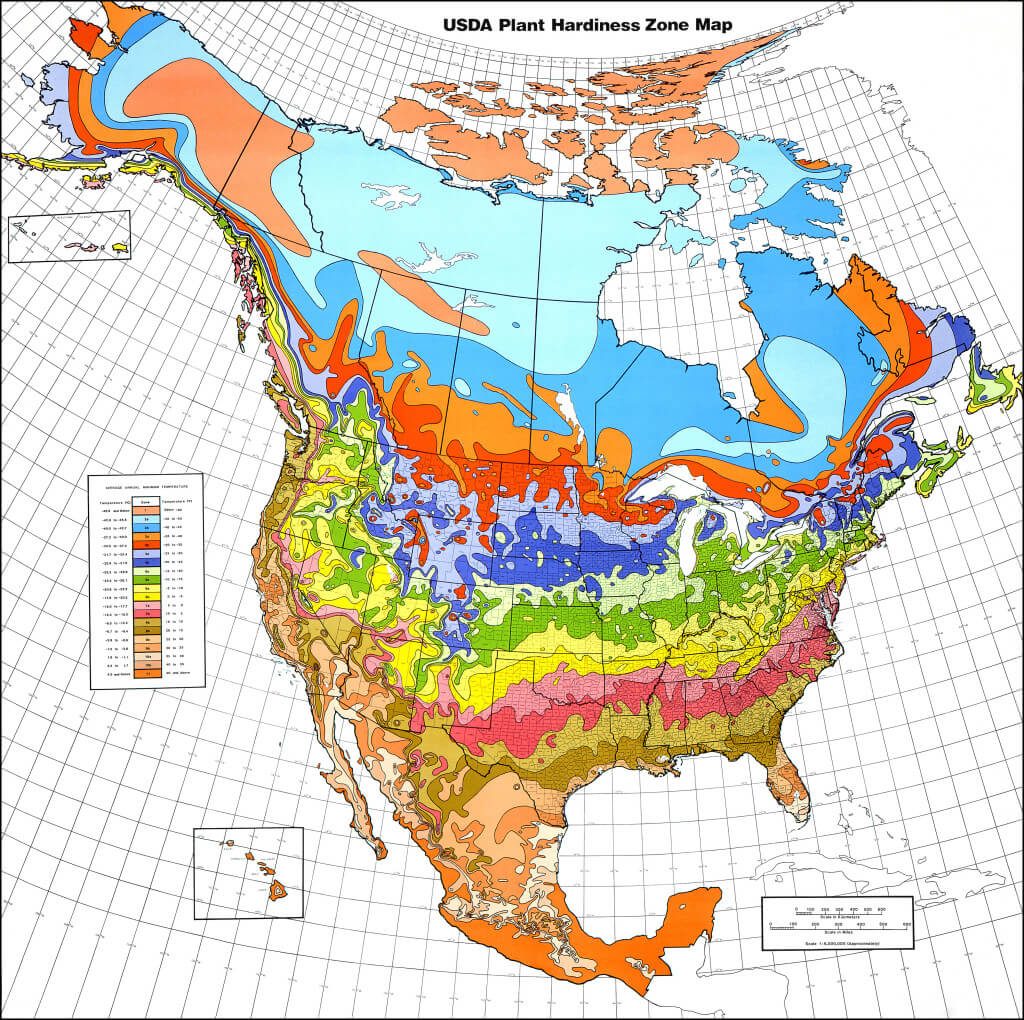
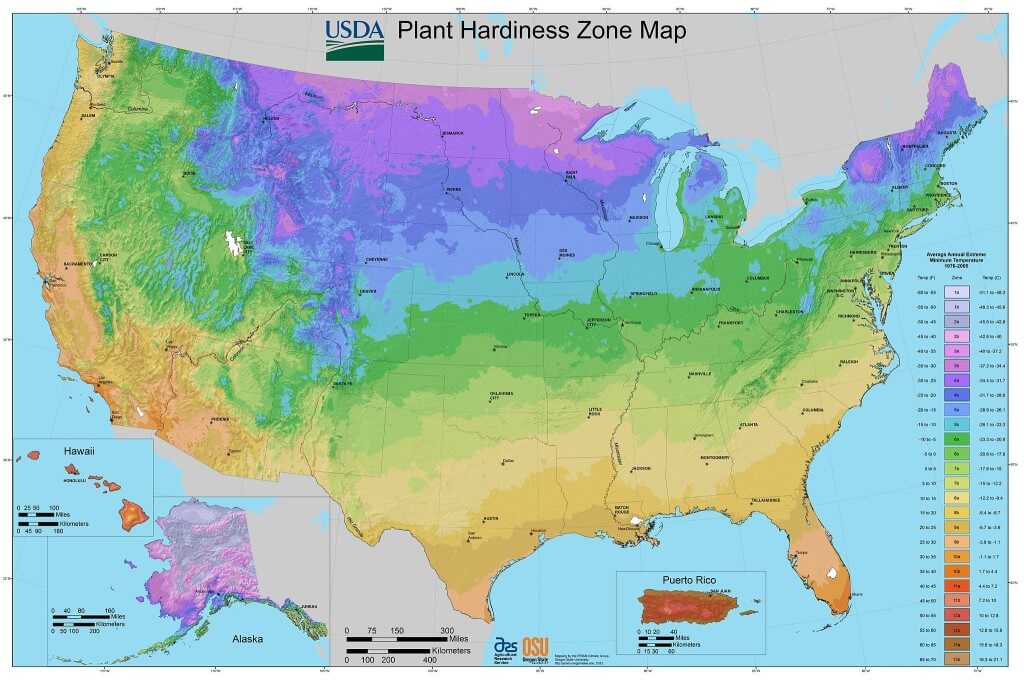
The USDA Hardiness zone Map is an attempt to divide the country into zones that give us some idea weather certain plants can be grown in any given area. The primary piece of data used to delineate the zones is the average annual winter temperature experienced in that area.
A Good System but Not a Perfect One
The USDA Hardiness zone Map is a good system because many plants are limited by minimum winter temperature, but many plants are also limited by other factors which are not considered in delineating the USDA Hardiness Zones. These factors include: maximum summer temperature, humidity, rainfall, snowfall, soil ph, soil moisture and urban heat increase. So these factors must be considered independently of the USDA Hardiness Zones. Abnormal and infrequent heat or cold snaps may also kill certain plants in zones that they are normally stable in.
Versions
There are a few versions produced at different times based on different data periods. 2 Maps are include here. The older version(1990) includes Canada and shows areas as being slightly cooler. The latest map(2012) does not include canada and should be the most accurate for our time but shows areas having warmer temperatures than earlier maps. Therefore many of the zones are slightly higher in latitude that previous maps.
(You may have to download and zoom in to see the descriptions of the zones)
Many of our readers find that subscribing to Eat The Planet is the best way to make sure they don't miss any of our valuable information about wild edibles.
See our privacy policy for more information about ads on this site

